If there is one word that could describe 2020, both in life and for the top 100 security dealers, it is unpredictable. Following several years of growth — and a very strong 2019 — SDM 100 companies found themselves on slippery ground beginning in March 2020 with the onset of the COVID-19 pandemic. It is hardly surprising this year that, when asked for their “most significant accomplishment” many wrote a variation of, “We survived.”
“Due to the challenges and unknowns surrounding the COVID-19 initial lockdown and ongoing pandemic, the market in 2020 was unlike any in recent history,” wrote No. 47, Supreme Security Systems Inc. “The market was spotty all year and there was no consistency, either up or down, in any specific market segment. Challenges were in all areas of operations, including sales, customer-facing activities and staff management.”
Custom Alarm, No. 80, wrote, “Overall sales revenue had increased about 3 percent year over year from 2019-2020. We were on pace at the start of the year to have a record year, until March. We wouldn’t consider this strong growth, but not bad considering nine months of it was affected by COVID-19 in one way or another.”
Objective of the SDM 100
The SDM 100 has been published since 1991. Its primary objective is to measure consumer dollars gained by security companies, in order to present an account of the size of the market captured by the 100 largest providers. SDM 100 companies are ranked by their recurring monthly revenue. RMR is the revenue associated with the contractual agreement between a security company and its subscriber — derived from customer billing for services such as monitoring, contracted service/system maintenance, security-as-a-service and managed/cloud solutions, and leasing of security systems — and is typically the basis for valuation of a security company. RMR is the language of security company executives and is meaningful in comparative analysis among industry peers. Of the 100 security dealers ranked, 35 of them earned more than $1 million in RMR in 2020.
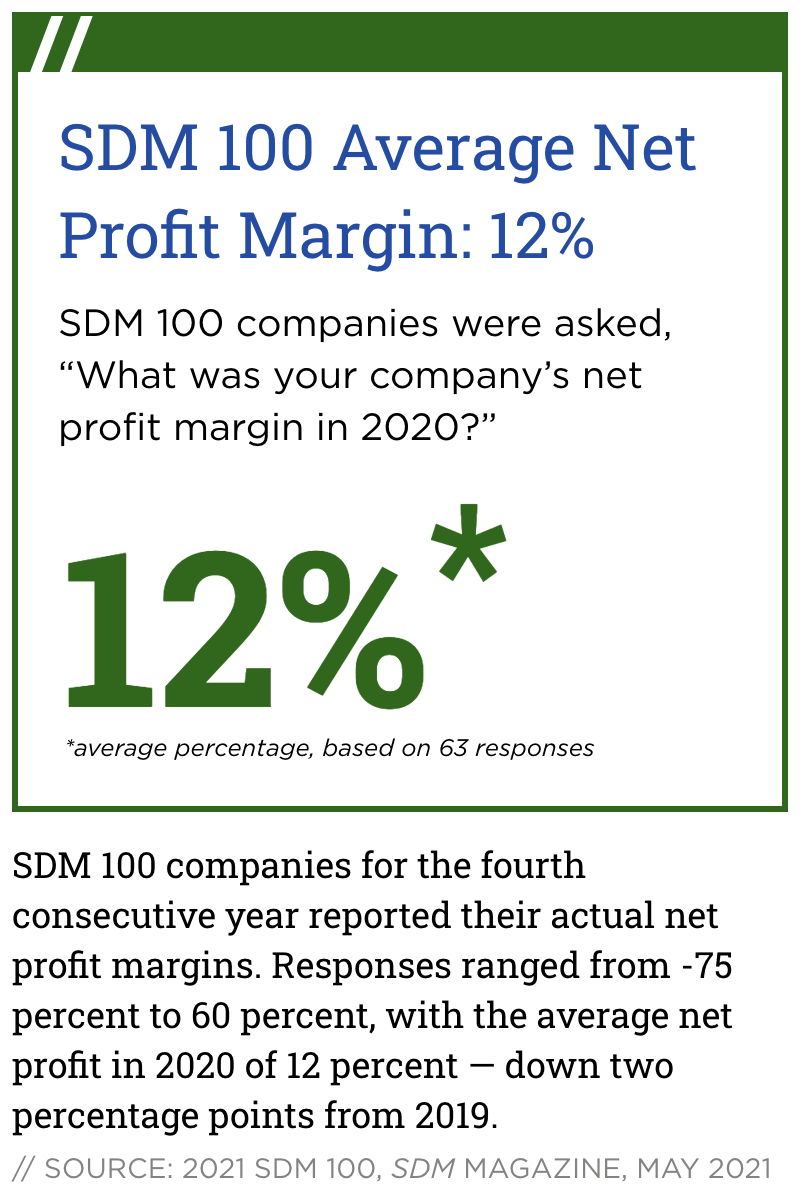
Across the board, there were clearly ups and downs this year, and a small number of the top dealers usually listed in this report chose not to apply at all this year. But as a whole, those that remain held their own. Annual revenue stayed steady at $10.8 billion, and RMR rose slightly at 1 percent. Eighty-two percent of the SDM 100 companies reported positive RMR growth, with some of the top 10 reporting positive growth at smaller rates than last year. Others, such as ADT and Brink’s increased their RMR in 2020 after a decrease in 2019, which helped boost the numbers. Only three of the top 10 reported lower RMR rates. If you take out the top 10 companies, the remaining 90 companies actually grew their RMR a respectable 9 percent, up from 8 percent last year. Total subscribers tipped down another 5 percent, continuing a five-year trend; but profits rose, with 50 percent of companies reporting an increased profit margin over 2019.
Charts and Graphs


Resilience Rules the Day

The publishing of the 31st annual SDM 100 list is a great time to take stock of the industry.
Core Growth
During the last year, we had a once in a 100-year pandemic, a recession, an unemployment rate that surged to just below 15 percent, and material changes to much of the way things are done in this country. What about the security alarm industry? According to our research, it grew recurring revenues by 2 percent! These revenues for ongoing services represent the best indicator of the size and reach of the industry. They also provide the vast majority of industry profits. A bright spot amidst the tragedy.
OK, it was hardly all good news. While the level of ongoing services increased, the level of sales and installation activity declined 5 percent in the year, which is not surprising given the shuttering and dislocation that occurred in the second quarter. While sales of new systems picked back up relatively quickly for the residential segment, the commercial segment did not begin to recover until very late in the third quarter. The 5 percent decline from 2019’s level is best viewed, however, in the following context: the resulting amount of activity totaled roughly the same as that realized in 2018. That is, even with the big “hole” in 2020, the industry still sold and installed as many new systems as it did two years prior. Additionally, just as in 2018, this level of activity replaced industry attrition and resulted in a net increase in the overall base of end users and the services provided — which is why recurring revenues increased.
Operating Improvements
From my perspective, however, the most impressive feat accomplished over the last year was the industry’s improvement in its core operating performance (i.e. the fundamental way in which it creates value). This is defined by three key performance indicators (KPIs): 1. the cost dynamic associated with originating new customers; 2. the profits realized from the ongoing services; and 3. the average life of customers. Two of these three KPIs improved (No. 1 and No. 3) in 2020 and early 2021. Higher pricing for the sales and installation activity that did occur improved the economics associated with originating customers, and the lowering of attrition (a welcome surprise!) extended the average life of customers. These improvements more than offset the slight decline in average margins on the ongoing service revenues. This is huge and speaks to the strength and resilience of the industry.
The Future Looks Bright
This also bodes well for the future. The economy is moving towards a fast recovery, and both consumers and businesses are seeking new ways to protect, monitor, and track what is important to them. This is a great time for the more efficient industry to continue to provide valuable solutions, and also to maintain the improved economics. It is needed. To fully capture the probable jump in growth will take a lot of capital, and pre-pandemic the industry had been showing signs of getting a little sloppy. Increased inefficiencies coupled with price discounting were driving lower returns on capital and pressure on company valuations. Now is the time to continue to show customers your value, demonstrate the improved economics of the business, and gear up for growth.
A good bellwether is ADT. They grew revenues in 2020 by 4 percent, and RMR by 2 percent. In addition, they tightened up operations, broadened their capability, lowered attrition — and received a $450 million investment from Google.
Data
My firm principally assists companies with acquisitions and the raising of capital. Like SDM Magazine, we also work hard to develop data that helps industry stakeholders better understand key trends. Typically, this information is showcased at our annual conference which we co-host with the law firm Buchanan Ingersoll & Rooney (the Barnes-Buchanan Conference). Unfortunately, we were unable to hold it this year, so we are making the cornerstone Industry Update and Overview available for purchase online. It contains a report with over 50 charts of data and analysis and is accompanied by a video briefing. — Michael Barnes is the President of Barnes Associates, Inc. an advisory and consulting firm that specializes in the security alarm industry. Contact him at mbarnes@barnesassociates.com.

Recurring monthly revenue (RMR) for SDM 100 companies was up only 1 percent in 2019, but indvidual results do a better job of substantiating true performance. In fact, 84 0f the top 100 companies had positive RMR growth in 2019, while just 16 percent were negative. The aggregate results were likely skewed by ADT's and Brink's RMR, which decreased 3 percent and 8 percent, respectively. Stand-out companies among the top 10 for 2019 RMR increases were Vector Security (25 percent), Securitas Electronic Security (20 percent), and Vivint Smart Home (11 percent).
Source: 2020 SDM 100, SDM Magazine, May 2020
Brought to you in part by 
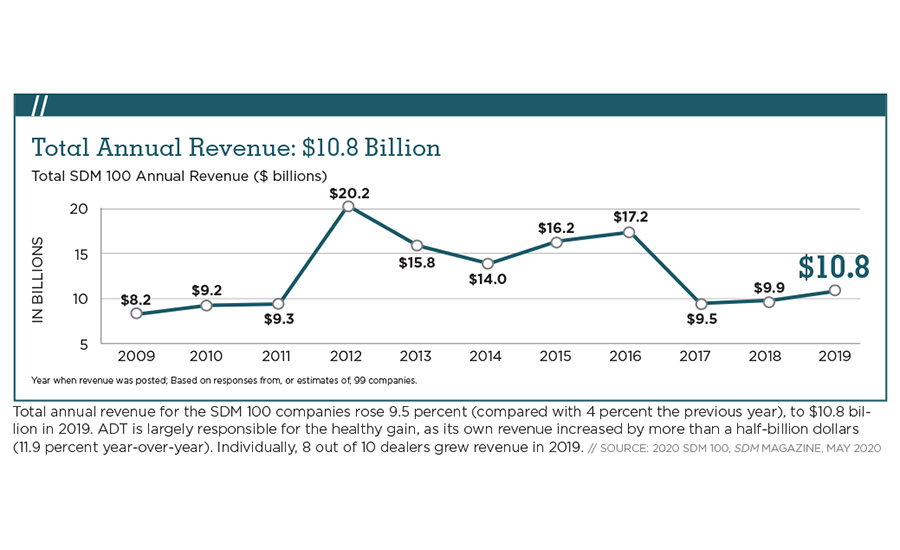
Total SDM 100 Annual Revenue ($ billions)
Year when revenue was posted; Based on responses from, or estimates of, 99 companies.
Total annual revenue for the SDM 100 companies rose 9.5 percent (compared with 4 percent the previous year), to 10.8 billion in 2019. ADT is largely responsible for the healthy gain, as its own revenue increased by more than half-billion dollars (11.9 percent year-over-year). Individualy 8 out of 10 dealers grew revenue in 2019.
Source: 2020 SDM 100, SDM Magazine, May 2020
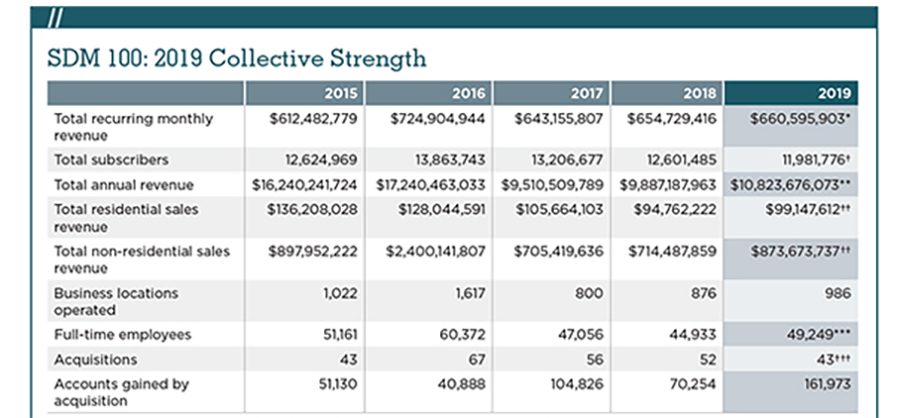
* Total monthly recurring revenue, based on RMR of Dec. 31, 2019. Based on responses or estimates from 100 companies.
† Based on responses from or estimates of 86 companies. Not included: Securitas Electronic Security; G4S Secure Integration LLC; SSD Alarm; Allied Universal Technology Services; Briscoe Protective; Redwire LLC; Sonitrol Great Lakes; Gillmore Security Systems Inc.; Richmond Alarm Company; Scarsdale Security Systems Inc.; Washington Alarm Inc.; The Protection Bureau; Yarnell Security Systems; PASS Security.
** Total annual (2019) revenue from electronic security system sales, installation, service, leasing, monitoring, and sales of subscriber accounts, as reported to or estimated by SDM. Based on responses from or estimates of 99 companies. Not included: The Protection Bureau.
†† Based on responses from or estimates of 74 companies. Note: Some companies either did not choose to report this figure or did not have sales/installation revenue to report in one of the categories.
Not included in Residential Sales Revenue are: ADT; Vivint Smart Home; Brink’s Home Security; Securitas Electronic Security; CPI Security Systems Inc.; Alert 360; My Alarm Center LLC / Alarm Capital Alliance; Kastle Systems Int’l; AMAROK LLC; NorthStar Alarm Services LLC; Per Mar Security Services; SafeTouch; G4S Secure Integration LLC; SSD Alarm; Allied Universal Technology Services; Briscoe Protective; AMP Smart LLC; Star Asset Security; Structure Works Inc.; A+ Technology & Security Solutions Inc.; EyeQ Monitoring; Richmond Alarm Company; Scarsdale Security Systems Inc.; The Protection Bureau; Hoffman Electronic Security; Sound Inc.; Trinity Wiring & Security Solutions; Yarnell Security Systems; Advent Security Corporation; Fortress Security; JSC Systems Inc.; Key Security Designs Corporation.
Not included in Non-residential Sales Revenue are: ADT; Vivint Smart Home; Brink’s Home Security; Securitas Electronic Security; CPI Security Systems Inc.; Alert 360; My Alarm Center LLC / Alarm Capital Alliance; Safe Home Security Inc. / Security Systems Inc.; Kastle Systems Int’l; AMAROK LLC; NorthStar Alarm Services LLC; Per Mar Security Services; SafeTouch; Select Security; SSD Alarm; Briscoe Protective; AMP Smart LLC; Richmond Alarm Company; Scarsdale Security Systems Inc.; The Protection Bureau; Hoffman Electronic Security; Sound Inc.; Trinity Wiring & Security Solutions; Yarnell Security Systems; Advent Security Corporation; Fortress Security.
*** Based on responses from or estimates of 96 companies.
††† Based on responses from or estimates of 27 companies.
Source: 2020 SDM 100, SDM Magazine, May 2020
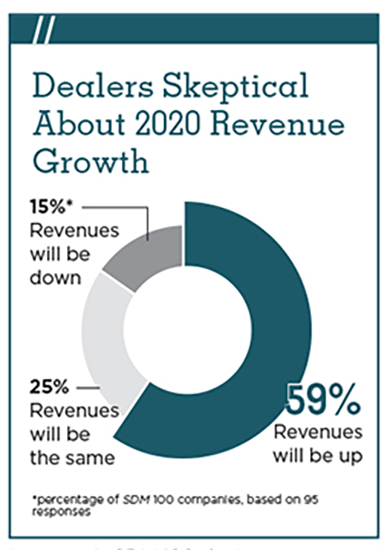
*percentage of SDM 100 companies, based on 95 responses
Source: 2020 SDM 100, SDM Magazine, May 2020
Source: 2021 SDM 100, SDM Magazine, May 2021
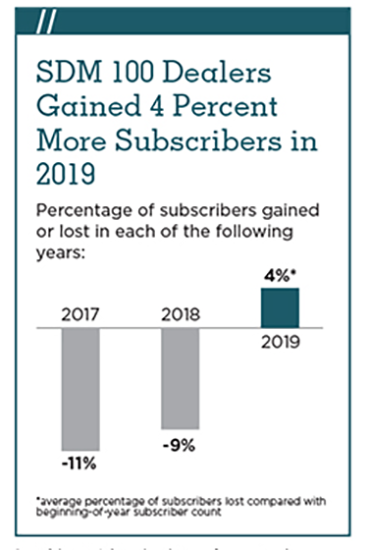
*average percentage of subscribers lost compared with beginning-of-year subscriber count
Source: 2020 SDM 100, SDM Magazine, May 2020
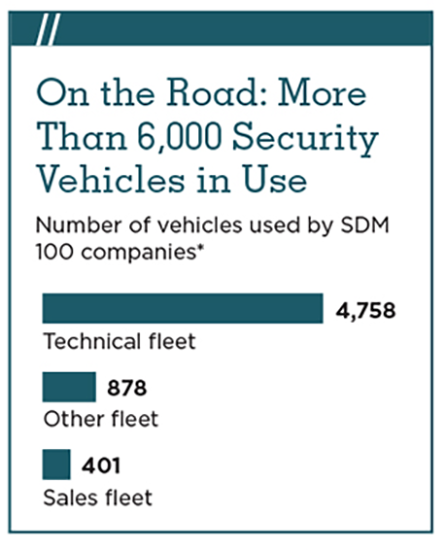
Number of vehicles used by SDM 100 companies*
Source: 2020 SDM 100, SDM Magazine, May 2020
A Chaotic Year
There was no single formula for success. Some found the residential market to be flat or in decline while others saw a boost from homeowners staying home — and working from home — who wanted to add security systems.
“COVID-19 definitely weakened the market for residential sales and monitoring. Commercial installations saw an uptick,” wrote No. 65, Crime Prevention Security Systems.
No. 4 Vector Security saw the opposite trend: “In 2020 having essential worker designation was crucial. Residential was a growth driver in 2020, with work-from-home creating opportunities for residential segments. The commercial vertical was challenged with up to 30 percent of businesses closing, which delayed work.”
They are one of the few exceptions, however, that reported an uptick in residential sales. Pandemic or not, the trend of softening residential — as DIY companies flood the market — is continuing for many.
Another issue many companies faced this year involved the supply chain. Whether related to the virus, or the trade war with China, it had an impact.
“Lumber yards were temporarily shut down during the pandemic as were manufacturing plants, causing supply shortages and backlog. At the same time, many products produced in China became subject to tariffs driven by the trade war. All of these factors increased the cost of doing business; and this was compounded by social distancing requirements on job sites, which resulted in production and scheduling challenges,” wrote No. 7, Guardian Protection.
Per Mar, No. 15, put it succinctly: “COVID-19 overall had a minor impact financially but a major impact operationally.”
Some found the Zoom approach to business inhibiting. “Lack of face-to-face interaction hurt sales efforts. We also missed out on networking events and industry trade shows that usually yield us more business,” stated No. 21, American Alarm & Communications.
Vio Security, No. 29 (formerly GHS interactive), added that restrictions on door-to-door sales hurt their business.
On the upside, the pandemic brought to the forefront some of the technologies and trends that had been on the cusp of taking off, but 2020 was the push they needed. Video was particularly strong, as was managed and hosted services.
With businesses shut down, more customers saw the value in remote video and access control systems to protect their closed facilities; while restaurants added video to protect their expanded outdoor dining areas.
“We had a very strong interest in both the residential and commercial markets for camera systems, and that interest did result in actual sales,” wrote No. 40, Matson Alarm.
While there were no shortages of challenges, companies like No. 72, Fleenor Security Systems, still managed to find an upside. “COVID-19 caused us to take some actions we would probably not have considered but in the end it has actually given us a new perspective that we can be successful with a remote workforce if needed. … Overall I would say 2020 was an incredibly challenging but successful year!”
How to Use the SDM 100 Tables
The 2021 SDM 100 ranks U.S. companies that provide electronic security systems and services to both residential and non-residential customers. This ranking is based on information provided to or, in few cases, estimated by SDM. Ranked companies were asked to submit either an audited or reviewed financial statement, or a copy of their income tax return showing total gross receipts for the stated period. The vast majority of the firms ranked are privately held.
The main table, ranks 100 companies by their recurring monthly revenue (RMR) of December 31, 2020. The company with the highest RMR is ranked as No. 1, and so on. For each of the 100 companies, the following information is provided, from left to right:
- Current year rank, which is based on Dec. 31, 2020, RMR.
- Prior year rank.
- Company name, as used in the marketplace (doing business as), and headquarters location.
- Amount of RMR billed on Dec. 31, 2020.
- Percentage of RMR increase/decrease compared with Dec. 31, 2019.
- Number of subscribers (recurring-billable customers) at year-end 2020.
- Amount of sales revenue from residential system installations in 2020.
- Amount of sales revenue from non-residential system installations in 2020.;
- Total gross revenue, in calendar-year or (the company’s) fiscal-year 2020 from security system sales/installation, services, leasing, and monitoring.
- Number of full-time employees.
- Number of business locations, including headquarters.
SDM 100 companies are then re-ranked by several other criteria, including total annual gross revenue; residential subscribers; and non-residential sales revenue. See the report online at www.SDMmag.com/sdm100report for more data than presented here.
Note: An e following the figure indicates it is an SDM estimate.
To find a company by name, use the alphabetical index.
The ‘Speed of Normalcy’
Looking ahead, there is a note of cautious optimism, largely centered around the vaccine rollout and how quickly the economy can open back up. As a whole, the SDM 100 companies have a positive outlook about revenues in 2021, with 78 percent predicting they will be up over 2020. But the impact of COVID-19 will continue to be a factor through much of 2021. And of course there was another major event that happened in 2020 that could have huge implications for this year: the election of a new administration. Both of these topics weigh heavily in the anticipation of what is to come.
“The market doesn’t know what direction to head right now with COVID-19 vaccines being administered, but variants of the virus springing up. Couple that with a flip of the senate and executive branch and everyone is waiting to see what will happen. I believe we may yet see a softening of the market in the first and second quarter and I hope a massive rebound in the last half of the year,” wrote No. 45, Peak Alarm Co.
“There is only one issue with any importance in 2021: reopening the economy. Until this takes place, probably as a result of near total inoculation, we will continue to deal with unpredictable unknowns,” said No. 47, Supreme Security Systems Inc.
Sonitrol Integrated Security, No. 81, wrote, “After 2020, I don’t see a whole lot that could change that much more. The biggest unknown will be how the new administration approaches things, but we have seen that security is vital no matter which team is in the White House and Congress.”
At its core, the security industry is a resilient one, however, and No. 62, DFW Security, is optimistic that no matter what happens the industry will thrive: “Our industry thrives in economic downturns and upswings. I expect 2021 to be a great year for our industry.”
JSC Systems, No. 89, is similarly hopeful for a strong recovery. “The speed of normalcy is the most obvious variable, which is directly tied to vaccination rates. If things go as projected, the second half of 2021 should be strong. We expect a normal school year in 2021, business to be back to normal capacity, and people to start traveling. In the geography where we operate, this points to investments in private and public construction. The volume of business we are bidding and proposing is at an all-time record. This is the best leading indicator of our potential growth.”
How to Purchase the SDM 100 Directory
Wouldn’t it be useful to have more information about each of the 100 companies ranked here? The 2021 SDM 100 Directory includes contact names, mailing addresses, telephone numbers, website URLs, branch office locations, product buyer names, installation data, and more. SDM 100 Directory comes in Microsoft Excel format. To order, contact Jackie Bean at 215-939-8967 or by e-mail to beanj@bnpmedia.com.


.png?height=200&t=1654697107&width=200 "sdm-100-2022")